http://www.cru.uea.ac.uk/cru/info/warming/

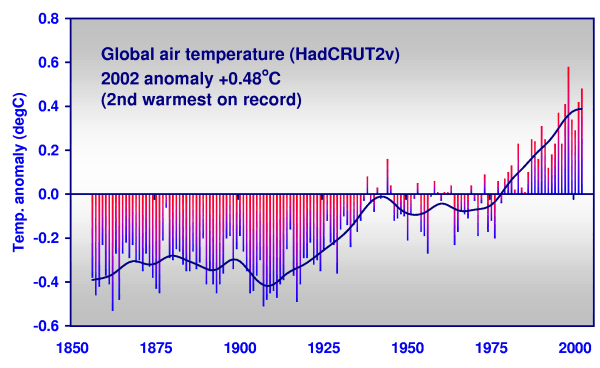
The time series shows the combined global land and marine surface temperature record from 1856 to 2002. The year 2002 was the second warmest on record. This time series is being compiled jointly by the Climatic Research Unit and the UK Met. Office Hadley Centre. The record is being continually up-dated and improved. The principal reason is to detect climate change due to global warming through an increase in temperature in the instrumental record. Increased concentrations of greenhouse gases in the atmosphere due to human activities are most likely the underlying cause of warming in the 20th century.
The key references for this time series are:
Jones, P.D., New, M., Parker, D.E., Martin, S. and Rigor, I.G., 1999:
Surface air temperature and its changes over the past 150 years.
Reviews of Geophysics, 37, 173-199.Jones, P.D. and Moberg, A., 2003:
Hemispheric and large-scale surface air temperature variations: An extensive revision and an update to 2001.
Journal of Climate, 16, 206-223.
The 1990s were the warmest decade in the series. The warmest two years of the entire series have been 2002 and 1998, with the latter the warmest at 0.58°C above the 1961-90 mean. The nine warmest years globally have now occurred in the 1990s and 2000s. They are, in descending order, 1998, 2002, 2001, 1997, 1995, 1990 & 1999 (joint), 1991 & 2000 (joint).
Analyses of over 400 proxy climate series (from trees, corals, ice cores and historical records) show that the 1990s is the warmest decade of the millennium and the 20th century the warmest century. The warmest year of the millennium was 1998, and the coldest was probably 1601.
The Inter-governmental Panel on Climate Change in its most recent report stated:
'most of the observed warming over the last 50 years is likely to have been due to the increase in greenhouse gas concentrations.'
There is also a long record of temperature for Central England. This is based on a paper by Gordon Manley:
Manley, G., 1974:
Central England temperatures: monthly means 1659 to 1973.
Quarterly Journal of the Royal Meteorological Society, 100, 389-405.
This is being continually up-dated, although as yet the statistics for 2002 have not been finalized. It shows that 1999 was +1.16°C above the 1961-90 average, the warmest year recorded in 341 years. The year 2000 was 0.85°C above the 1961-90 average. The year 2001 was cooler at only 0.47°C above the 1961-90 average, although October 2001 was the warmest October on record.
| © Copyright 2003, Climatic
Research Unit. You may copy and disseminate this information, but it remains the property of the Climatic Research Unit, and due acknowledgement must be made. |
| For further information on
this subject please contact: cru@uea.ac.uk |
Last updated: January 2003, Jean Palutikof